While you could use Excel to make a scatter plot, another way you can do it is to use the freely-available Google Sheets to make a scatter plot instead. In this article, we’ll explain how to make a scatter plot in Google Sheets, including how to customize it once it’s created.
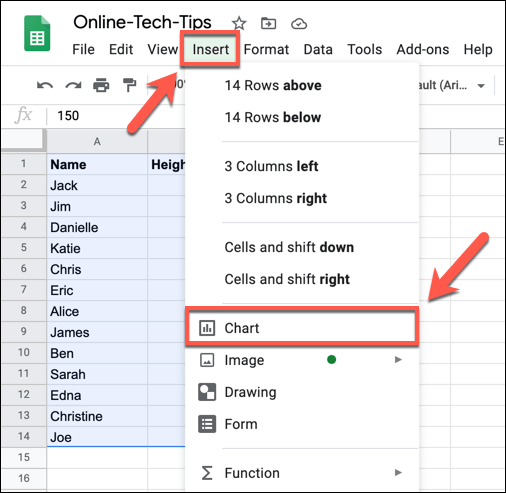
How to Make a Scatter Plot in Google Sheets
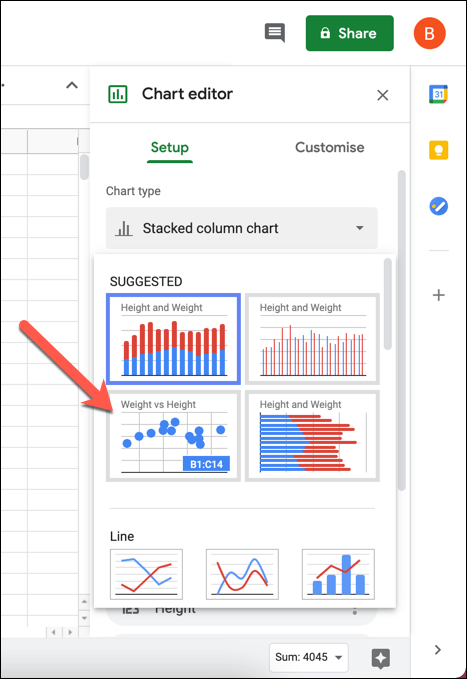
A scatter plot, as the name suggests, uses scattered dots across a chart to visualize two or more types of linked data. For instance, if you wanted to compare the sales and profits of a sales team, a scatter graph (showing the profit vs the sales revenue) would be perfect, showing the profit and revenue for each salesperson. As long as you have two comparable data sets, it’s possible to create a scatter plot, and Google Sheets makes this easy with its chart creation tool.
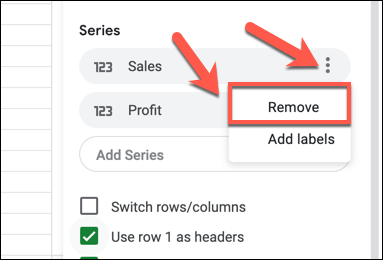
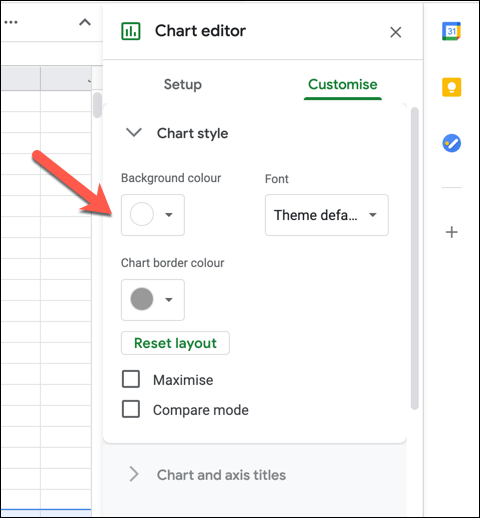
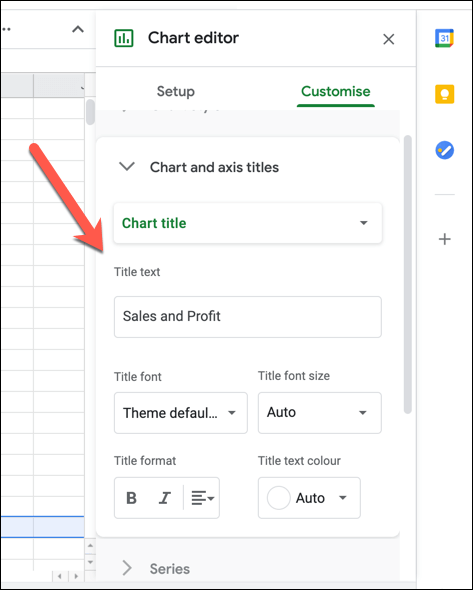
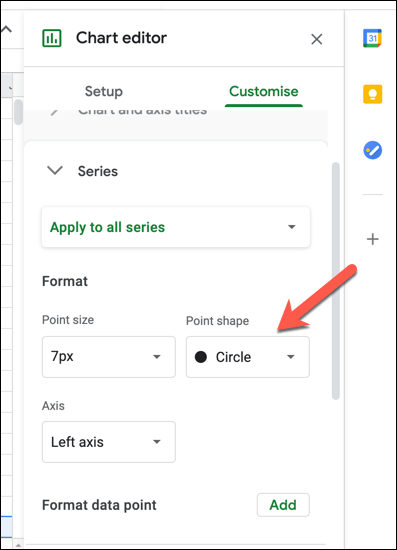
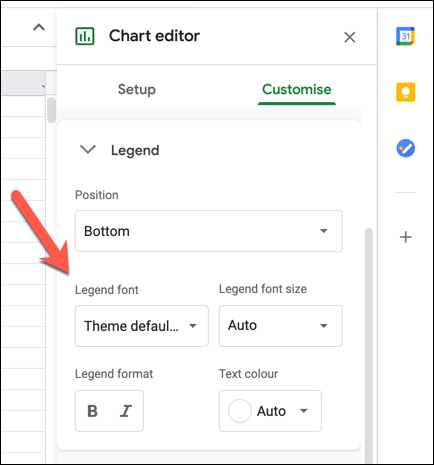
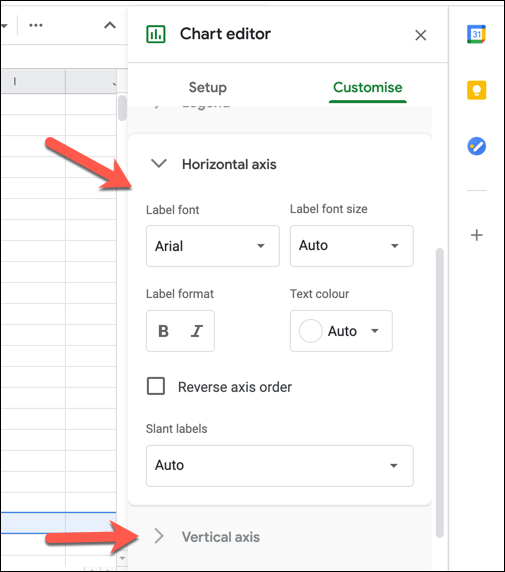
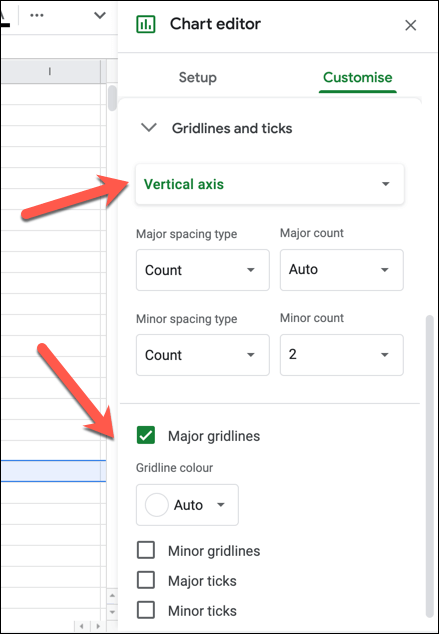
Customizing a Scatter Plot
Like all charts and graphs in Google Sheets, the chart editor offers a number of additional customization options. This allows you to change labels, axis titles, colors, fonts, and more.
Create Visual Spreadsheets
Now you know how to make a scatter plot in Google Sheets, you can also experiment with creating other Google Sheets graphs and charts for data analysis, from a line chart to a bar graph. If you’re struggling, there are Google Sheets templates you can use to get started, ready for you to fill with data and create your own charts around it. Experienced Excel users can also convert spreadsheets to Google Sheets with ease, although some features (like Excel macros) won’t be supported. You can take things even further, using Google Sheets scripts to expand functionality and integrate spreadsheets with other Google and third-party services.